
At Pre-Seed, Learning Velocity Beats CAC
Investors think like this:
“Show me a team that learns faster than they burn cash. If they can do that, they’ll find scale.”
At pre-seed, you don’t need a big marketing org. You need a system.
A way to run systematic GTM experiments, learn fast, and prove you can turn insights into traction.
CAC is a trap at pre-seed
Every founder wants to impress with a slick CAC number. But here’s the truth:
Your CAC at pre-seed is fake news.
Why? Because you don’t yet have:
Repeatable channels
Optimized funnels
Enough volume to make the math meaningful
At this stage, chasing CAC is like weighing yourself after the first gym session. It tells you nothing.
What matters instead: systematic GTM experiments
What I look for in a team is whether they can run experiments with discipline.
The questions I ask:
How many experiments in the last 60 days?
What did you learn?
What did you kill, and what did you double down on?
If you can’t answer those, I worry. If you can, I don’t even care if half your experiments failed — that’s the point.
How to log and measure your experiments
It’s pretty easy to set up your own dataset of experiments using a tool like Notion.
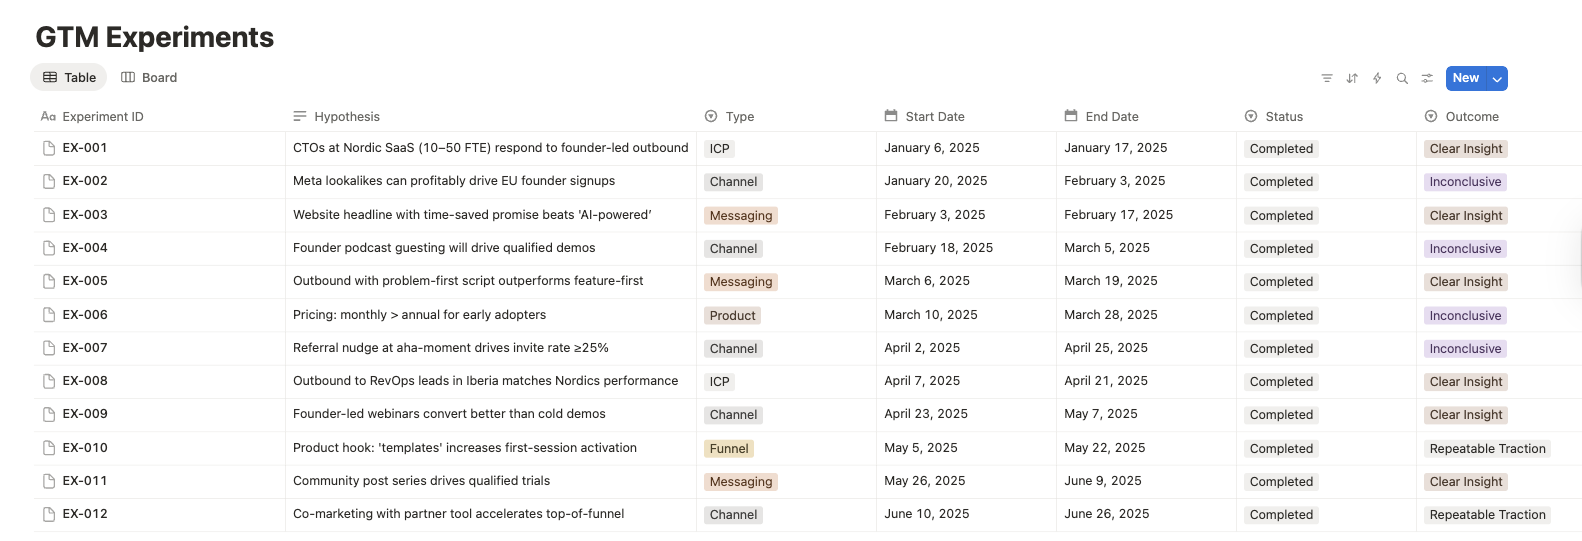
Step 1. Track every experiment
For each GTM test, capture:
Hypothesis
Start/end dates (cycle speed)
Outcome (clear signal or not)
Decision (kill, pivot, scale)
Think of it like a sales pipeline, but for experiments.
Step 2. Categorize outcomes
Inconclusive → “We ran FB ads across Europe → CTR 0.2%, no ICP signal.”
Clear insight → “Cold outbound to SaaS CTOs in Nordics → 8% reply rate vs. 2% baseline.”
Repeatable traction → “Referral program among early users → 30% invite rate sustained three months.”
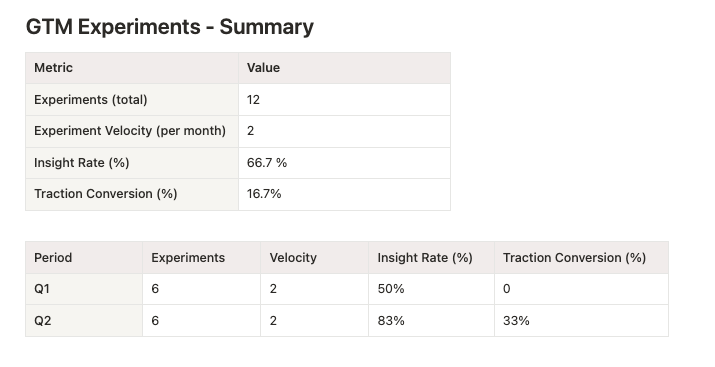
Step 3. Measure ratios & improvement
Experiment velocity = # completed experiments ÷ month
Insight rate = # insights ÷ # experiments
Traction conversion = # repeatable motions ÷ # experiments
Example:
Months 1–3: 6 experiments → 3 insights (33%), 0 repeatable (0%)
Months 4–6: 6 experiments → 5 insights (83%), 2 repeatable (33%)
That’s evidence of faster learning — and a strong signal this team has what it takes to discover product–market fit.
How to present it to investors
Instead of vague vanity metrics, say this:
“In the last 6 months, we’ve run 12 GTM experiments.
8 gave clear insights (67% insight rate, up from 50% in the first 3 months to 83% in the last 3).
2 scaled into repeatable traction (17% traction conversion).
With 10 months runway left, we expect ~20 more experiments, yielding ~13 insights and ~3–4 repeatable motions.”
This reframes burn rate:
You’re not “burning €50k/month on marketing.”
You’re buying 2 experiments/month, with a 67% insight yield and a 17% traction conversion.
Final thoughts
Ensure you have the right marketing team and leadership to:
Prioritize the right hypotheses
Design clean experiments
Turn messy learnings into a credible story
If you can show investors you’ve built a system to test, adapt, and improve, you’ll raise seed on proof — not promises.
And from what I’ve seen across the Nordics, Iberia, and the wider European scene — that’s the difference between startups that fizzle, and startups that get to play the bigger game.